Advanced Analytics
Data-driven decision making
Comprehensive analytics dashboard with customizable widgets, real-time updates, and predictive insights.
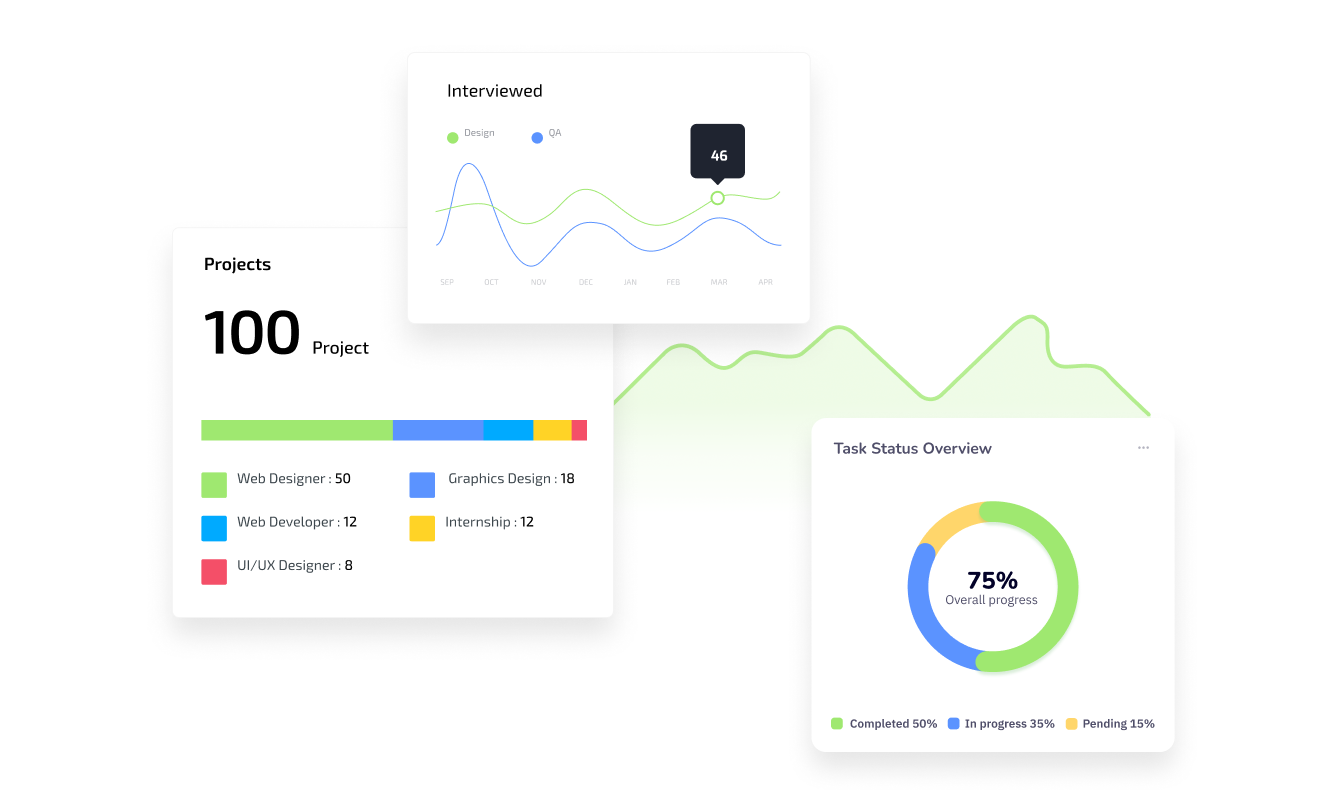
Customizable analytics dashboard
Analytics Dashboard Software for Project Reporting
Powerful Analytics Dashboard for Better Decision-Making
Gain visibility into project performance, team workload, and key work metrics. Monitor progress, review trends, and use a centralized analytics dashboard to decide where your team needs to investigate or act next.
The problem it solves
When updates are spread across task lists, project boards, and timesheets, status reviews take longer and emerging delays are easy to miss. A shared dashboard gives managers a consistent starting point for each review.
Main analytics capabilities
Configure the dashboard around the questions your team needs to answer, then move from the summary back to the underlying work.
Customizable dashboard views
Arrange the available widgets around the project, workload, and performance information your team reviews most often.
Real-time progress visibility
Review task progress, deadlines, project status, and workload from one reporting view instead of checking each work area separately.
Trend and predictive insights
Use the available trend and predictive views to identify patterns that need attention, then validate them against the underlying work data.
Report export
Use the available export options when a report needs to be shared or reviewed outside the dashboard.
How a dashboard review works
- 1Choose the project, team, or work area you want to review.
- 2Configure the available dashboard widgets around the metrics that matter to that review.
- 3Check progress, workload, deadlines, and trend indicators for exceptions.
- 4Open the underlying tasks or projects before assigning follow-up actions.
Example weekly project review
A project manager can start with the project dashboard, compare completed and overdue work, review workload distribution, and identify a milestone that is at risk. The manager can then open the related tasks, confirm the cause with the owners, and record the next action in the project rather than relying on the chart alone.
Teams that commonly use these views
- Project and portfolio managers reviewing delivery progress.
- Team leads balancing workload and overdue work.
- Operations teams monitoring repeatable processes.
- Leadership teams reviewing goals and project outcomes.
Connect reports to the work they explain
Analytics is most useful when the source work is structured consistently. Connect reporting with task management, review team effort through time tracking, and compare delivery with goals in the OKR system.
Analytics dashboard FAQs
What is an analytics dashboard?
An analytics dashboard is a visual reporting tool that helps teams review project progress, performance metrics, and productivity information from one place.
How does an analytics dashboard improve project visibility?
It brings task status, deadlines, workload, and project progress into a shared view so managers can identify where a closer review is needed.
What metrics can I track with the Hidesc dashboard?
The page lists project progress, task completion, team performance, workload distribution, and deadlines. The metrics available to a user can depend on the configured workspace and dashboard.
Can analytics dashboards help improve team productivity?
They can help teams spot bottlenecks and workload patterns earlier. The dashboard supports the decision; managers should still review the related work before making changes.
Can dashboard information be exported?
Hidesc lists report export as an analytics capability. Confirm the available export option in your workspace before planning a reporting process around a specific file format.
Ready to get started with Advanced Analytics?
See how this feature can support your team's workflow in Hidesc.